Measuring the accuracy of security tests
“Without data, you’re just another person with an opinion.” – W. Edwards Deming
You might be most familiar with Checkmarx Zero from our work educating and informing the application security community. But the accuracy of the Checkmarx security scanning engines is a significant focus for us; we spend a lot of time improving coverage to make sure we miss as little as possible, and improving the precision of our detections to make sure what we find is real and actionable. After all, security and development teams can’t act on risks they don’t understand, nor can they afford to waste large amounts of resources chasing risks that don’t exist.
But how do we know how accurate we are? How do we know if a change we make to our scanners actually improves accuracy? Can we trust the published research? Building a system and process for answering these questions turns out to be hard to get right; but it is worth doing well, especially for SAST (Static Application Security Testing).
Mario Kart champions make terrible F1 drivers
There is no shortage of studies and vendor claims that confidently rank which security tools are “best”. These studies aim to test the capabilities of scanners in real-world situations. But unfortunately, many end up actually testing a dramatically simplified alternative. That’s a bit like setting out to find the next champion F1 driver by seeing how well they play Mario Kart.

Some common methodology problems we’ve noticed:
- Picking only one aspect of accuracy. Often research will focus only on how many vulnerabilities are detected, or how many detected weaknesses are valid. But those are only a slice of the accuracy pie.
- Unrealistic test data. Researchers will often choose very simple applications, because they’re easier to analyze. But test accuracy on a simple application isn’t a very good predictor for accuracy on complex, real-world enterprise apps. Or, worse, they’ll choose well-known benchmark testing suites which tools are often tuned to perform well on.
- Poorly established ground truth. If you want to know how accurately a test is, you have to be able to compare its results with reality. If a SAST scanner says there’s a weakness in some application, you need to know if that’s true or not. Many researchers chose to deliberately add weaknesses (which is prone to mistakes that can make the results useless), trust existing lists of issues, and so on without really acknowledging the error these choices introduce to the results.
When your goal is to determine how well your own tool performs in the real world, this doesn’t work.
An overview of our test approach and results
In short, while there is no perfect solution to determining the accuracy of something like a SAST scan, we have built a repeatable process for getting high-quality results. And we use that process to evaluate proposed changes to our engines, which lets us consistently improve the accuracy of our scans and reports.
Our most recent round of testing has been focused on figuring out where, if anywhere, LLM-based scans could improve accuracy of our SAST engines. Our basic method when applied to SAST is:
- Carefully select open-source applications that share many attributes we observe in real-world enterprise applications developed by our customers: design patterns, adopted frameworks, architecture decisions, etc.
- Scan these projects with a wide variety of publicly-available SAST tools, and then our own engines, and manually analyze the results.
- Manually review every report of an issue, and determine if that report is correct. A correct report for a given scanner counts toward it’s TP (true positive) count; an incorrect one counts as an FP (false positive).
- Combine all scanners’ TPs, manually de-duplicate them, and add in issues discovered from manual code review; this establishes the overall pool of security issues (TP-pool).
- When all scanners results are reviewed, we make a second pass on those results to determine if each scanner properly detected everything in the TP-pool. If it missed something, this is counted as an FN (false negative) for that scanner.
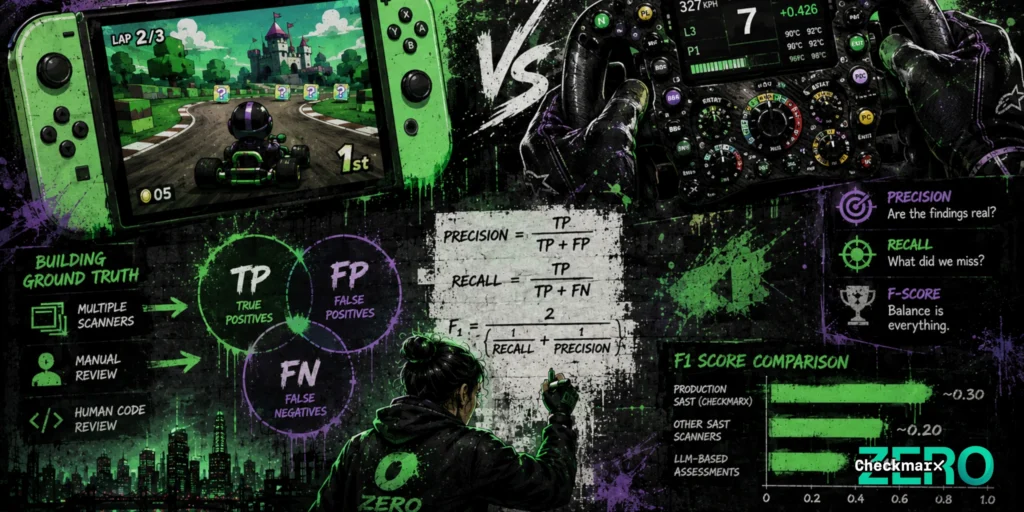
- Calculate the F1 score (aka F score) for each scanner.
- Precision (P) is TP divided by the total issues reported (TP+FP).
- Recall (R) is TP divided by the total issues that should have been found (TP + FN).
- The F1 score is the harmonic mean of P and R.
- Repeat this test with proposed improvements / configurations of our own SAST scanner, and compare the F1 scores to each other and to other scanners available.
We find that the standard F1 variant of the F-score provides the best outcome for ensuring that precision and recall stay in balance; so when we say “F-score”, we mean this default F1 variant.
We conducted this round of testing to compare our SAST results alone to AI-based security assessments, and to combining AI results with our scanner. We found:
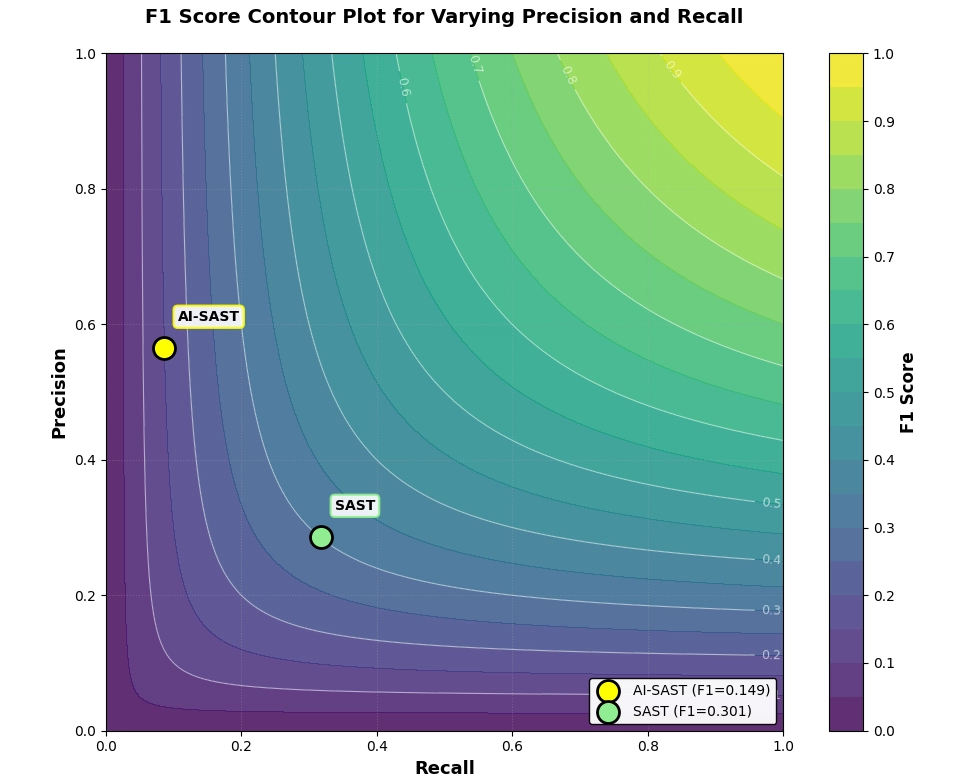
- Our scanner’s default configuration has an F-score of ~0.30 compared to other SAST scanners that hover around 0.20. This validates that we have a high-accuracy scanner already, but also shows there’s room for us to improve.
- Products based on general-purpose Large Language Models have an F-score of ~0.15. Models like Opus and Sonnet have very high precision (if they report a specific vulnerability, they’re right more than they’re wrong), but very low recall (they miss a lot of stuff more established scanning tools can find). This tells us that using an AI tool alone is significantly worse than using a more-established SAST tool for security. But it also suggests that there is real value available.
-
It is possible to use LLM as a supervisory agent to obtain a final F-score of ~0.499 or more. Pure results combination doesn’t perform as well as a hybrid approach that allows different styles of security testing to supplement each other. Some of our approaches allowed us to exceed
F1 = 0.7 , suggesting that there is room for continued innovation.
These results tell us we’re heading in the right direction by exploring tactics to effectively combine LLM and deterministic methods; and our methodology helps us quickly rule out approaches that aren’t adding enough value.
“It is possible to use LLM as a supervisory agent to obtain a final F1-score of ~0.499 or more. Some of our approaches allowed us to exceed F1 = 0.7.”
A more complete vision of accuracy
We figured out that to be useful, a measure of accuracy for a security tests has to consider two big questions:
- How many of its findings describe real, valid security issues?
- Of the issues that exist in the applications being tested, how many does it actually find?
Fortunately, for us, this pair of questions is strikingly similar to test accuracy questions in other fields like medicine. So we can borrow from existing definitions to get to a working “accuracy” definition that helps us assess and improve our scanners.
And there’s even a statistical score that can express the relationship between the answers to these questions as a single value: the F1-score. The harmonic mean of precision (a way to answer question 1) and recall (a way to answer question 2).
Precision here can be thought of as how close to perfect the test is when it comes to false positives. A test that had zero false positives — that is, a test which never reported an issue that wasn’t an issue — would be a perfect precision: 1.0. Anything else is lower than that; and if every single issue reported was wrong, that would be a precision of 0.
We calculate precision by looking at all reported issues from a scan, and determining which of them are real and valid security issues in the tested applications. Any it gets right are TP (true positive), any it gets wrong are FP (false positive), and:
Recall, then, is how close to perfect the test is when it comes to false negatives. A perfect 1.0 recall would mean that the scan didn’t miss any issues. If it misses every issue, it would have a recall of 0.
We calculate recall by comparing the set of reported issues from the scan and determining if any issues in the tested application were missed. Any it missed are FN (false negative). We use the TP value we used for precision and calculate:
Once we have those, we can calculate the F1-score to get a value that weighs them both. A perfect scanner would have no false negatives and no false positives, and such a scanner would have
Why so complicated? It keeps us honest.
That seems like a lot, but there’s good reason for it: precision and recall affect each other. They’re not perfectly proportional, but things that increase precision tend to reduce recall. And the reverse. The F1-score keeps us from over-valuing one or the other, and the precision and recall values can help us understand what we need to improve.
Consider that I can have a scanner with perfect precision if I report just one issue, and it’s a true positive. Marketing would happily spend advertising budget telling everyone about their “no false positives scanner” product.
But that wouldn’t help build a better product. That scanner would have near-zero recall. And that would result an a low F-score. That’s why it matters. F1 scores punish imbalance between precision and recall, which helps avoid overly-prioritizing just one at the expense of the other.
Choosing the right apps that reflect real-world challenges
Many SAST accuracy studies use constructed data sets that are extremely simple (deliberately vulnerable, constrained to a particular language, small applications, etc.) — this is likely because it’s cheaper and easier, but it’s not particularly useful for really understanding accuracy.
Real world applications are complex, even messy. They depend on open-source frameworks. Delivering accurate results on these applications is much more complex than getting good results on artificial benchmarks or small sample applications.
Ideally, we’d test our accuracy on real customer applications; but for many organizations, that would raise intellectual property and data management concerns that make this approach impractical.
Instead, we carefully select a number of open-source applications that have many properties in common with real enterprise applications:
- they’re complex, with long data and control flow paths which are not entirely contained within first-party code
- they rely on popular and trusted open-source libraries and frameworks
- they have large numbers of production users and the associated revisions made to fix bugs and add features over time
- they use modern and common architecture and implementation patterns
This sample gets us as close as possible to testing with real enterprise applications, which reduces a significant source of error in the results.
The “ground truth” problem
In order to determine something is an FP (false positive), our researchers can examine the reported issue and then examine the claim made by the scanner. Determinations can be made by asking questions like:
- Is there a weakness where the scanner says there is?
- Is it the weakness the scanner is reporting?
- Does the data and control flow through that weakness support the conclusion that there’s a security issue?
But determining where there is an FN (false negative) is a lot harder. How can you be confident in claiming that a scanner missed a real security issue? Doing a great job here is an expensive proposition, so many researchers pick a low-cost option and simply accept the problems. For example:
- Introducing vulnerabilities. Researchers may reason that if they introduce vulnerabilities to code, then they’ll know whether those vulnerabilities are detected by the scanners they test. But these vulnerabilities tend to be very simple, rather than reflections of real-world issues, which reduces the value of the results. On top of that, we’ve seen several cases where an intention to introduce a weakness vulnerability actually fails to do so (like one case where the vulnerability had no valid logic or data flow, so more capable scanners get penalized for correctly identifying that it poses no risk).
- Using reported CVEs. Scanning open-source projects with documented CVEs and then seeing of the scanner finds the related weakness seems like a solid plan. Unfortunately, this approach tends to unfairly reward scanners that find “low hanging fruit” that most CVEs represent while ignoring more subtle issues.
Ideally, we’d like to deeply manually review every test application to have the highest chance of finding as many issues as possible. But not only is that approach extremely resource-intensive, it isn’t anywhere near high-accuracy enough to justify that extra effort.
Our solution is to accept that a degree of error in measuring FN rates is going to happen, and use a broad selection of scanners to establish ground truth. Essentially, we scan the test projects with a large number of tools – if any tool finds an issue, and we determine that is a TP, then we can confidently say tools that do not find that issue have an FN. We do the same process with a human code review.
This process is still resource-intensive: for our 7 core test applications in our most recent run, we spend 33 person-days on analysis of nearly 2500 weaknesses to get our findings. A lot of this complexity comes from the difficulty of fairly comparing deterministic outputs (such as produced by established SAST technology) with the generative and probabilistic outputs of an LLM-based assessment. But even between deterministic outputs, simple comparisons (like matching on CWE, file-and-line, etc.) tend to produce errors. Manual analysis ends up being an important task even when tools can help reduce the load.
And still we must accept that even with that level of examination, there are probably some security issues that no one knows about, and that means there will be some error in the FN counts, and thus in the recall score.
But this approach does allow us to have a repeatable basis of comparison with an error rate low enough to be acceptable, without spending years on the problem.
Data sets you free
This analysis approach is expensive; our exploration of SAST accuracy alone took 33 person-days for 7 applications with almost 2500 weaknesses – and we have plans to scale this to hundreds of applications with an expected 1,000,000+ weaknesses.
The F-score and its Precision and Recall components give us an important quality measure that informs our engineering decisions. It’s not the only factor that matters of course. Accuracy must be weighed against performance, repeatability, operational costs for our customers, etc. — improving an F-score by 0.05 isn’t exciting if it means the scan slows down software delivery by a lot, for example. But when we can, as we have with our AI-hybrid scan experiments, increase our F-score up into the 0.49–0.7 range or more, that’s genuinely exciting!
But we do this analysis because it makes sure that Checkmarx is able to make improvements to scanner accuracy that help our customers solve real security problems. It keeps us honest, and it keeps us focused on what matters: helping organizations manage their application security risk.
Checkmarx Security Research Team
Checkmarx Zero
CxSAST